
For more information and analysis about this poll, please visit The New York Times website.
Methodology Statement:
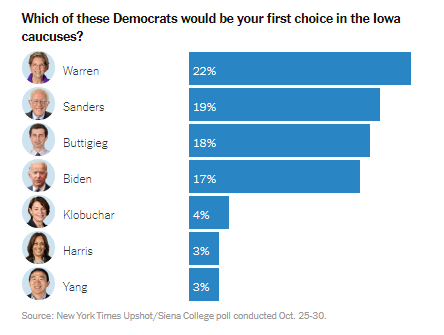
The New York Times Upshot/Siena College Research Institute survey of 1,435 registered voters in Iowa and 439 likely caucus-goers was conducted between Oct. 25 and Oct. 30.
The survey is a response-rate adjusted stratified sample of registered voters selected from active registered voters on the L2 voter file, with an oversample of registered Democrats.
The probability of selection was inversely proportionate to telephone coverage in each strata and the probability of response, based on responses to 2018 Times/Siena surveys. The strata was defined by the interaction between party and region. Finally, an oversample weight was applied to target Democrats at 50 percent of respondents. Overall, registered Democrats represented 52 percent of respondents.
Voters were contacted on cellular and landline telephones. Interviewers asked for the person named on the voter file, and ended the interview if the intended respondent was not available. Overall, 65 percent of Iowa Democratic caucus respondents were reached on a cell phone, and 35 percent were reached on a landline.
The sample was weighted to match the composition of active registered voters by age, race, region, turnout, party registration, gender and education.
Population parameters for the composition of registered voters were based on active registered voters on the L2 voter file, except education.
The estimates for education are based on a model of turnout in the November 2016 voting and registration supplement to the census Current Population Survey, adjusted to match current statewide voter registration figures and estimates for the demographic composition of the adult civilian non-institutionalized population, based on data from the American Community Survey.
The likely Iowa Democratic caucus electorate was defined in two steps. First, registered voters were asked whether they would probably vote in the Iowa Democratic caucus, Republican caucus, or neither caucus. Voters who said they would probably participate in the Democratic caucus were assigned a probability of voting based on how likely they said they were to vote in the Iowa Democratic caucus. The probabilities were calculated based on how often voters who had answered similar had proven to be validated voters in prior Times/Siena surveys matched to post-election L2 voter files.