Rhode Island Life Index
In the state of Rhode Island, SCRI has conducted several annual surveys to help develop the Rhode Island Index in partnership with Brown University and Blue Cross Blue Shield of Rhode Island. To learn more about this research, please visit the RI Life Index website.
Yes, we are in the field calling Rhode Islanders!
Connecticut Community WellBeing Index (DataHaven)
In the state of Connecticut, SCRI has conducted the community well-being research in partnership with Datahaven for over a decade. To learn more about the survey and its findings, please visit the DataHaven website.
New York Community Wellbeing Index (DataHaven)
Through a successful partnership with DataHaven, the Siena College Research Institute replicated their community-well being study in the state of New York. To learn more about the New York study, please visit the Academy of Medicine’s webpage on the research and SCRI’s website.
Conceptual Framework
Stakeholders are interested in quantifying the health of a community. Communities want to measure their community health to help decision makers target initiatives and funding toward improving the lives of residents. A healthy community can cover a variety of different measures including community quality, civic engagement, health (physical and mental), life chances of young people, economic well-being, and the presence of discrimination.
The Siena College Research Institute has developed and tested a survey instrument and analysis approach to help communities quantify the health and well-being of residents in a geographic area. By empowering local governments and community organizations with this information, data-driven programs and initiatives can be implemented to improve the quality of life for residents.
This survey instrument developed by SCRI in partnership with community stakeholders measures several different indices. Some are included below:
- quality of services available to citizens
- degree to which residents are satisfied with life in the community
- participation of residents in civic life
- self-reported physical and mental health
- degree to which the community believes that its young people have the chance to live a productive and fulfilling life
- economic opportunities available
- food security
- the degree that race and ethnicity impacts individual outcomes and success
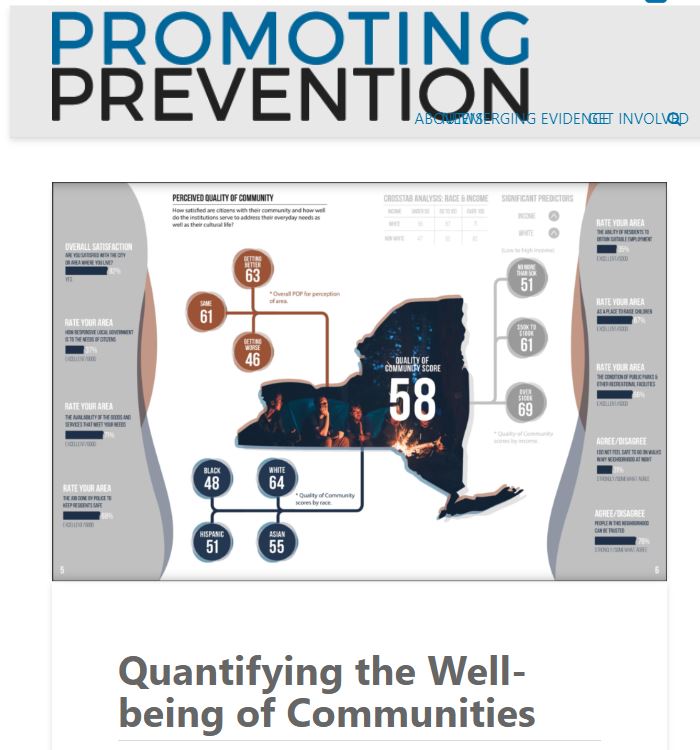
Using the indicators asked in the public opinion survey, an index value known as the Percent of Possible (POP) score is developed to give stakeholders a clear picture of community performance across the well-being criteria. The POP scores show how close to ideal the perception of the measure is. The higher the score, the higher the quality of community in the specific metric.
To calculate the POP score, the Siena College Research Institute assigns quantitative values to the survey responses on each indicator and sum each individual’s answers to develop a score that ranges from 0 to 100.
POP scores are not only developed for each individual indicator, but a total POP score is derived from the combination of all the indicator POP scores. Whether evaluating each indicator POP score or the total POP score, communities can dissect their results by comparing scores by demographics such as income, race, age, and gender.
Without needing an advanced degree, communities can interpret the POP scores and identify where investments and initiatives should be made.
Using the POP scores as the dependent variable, the Siena College Research Institute can provide communities with a measure of how much specific independent variables impact the overall POP score. For example, SCRI has found that significant predictors of total health of residents include income and educational attainment. Through the identification of significant predictors of community well-being, communities can target their programs and initiatives to reach specific populations.
Process of Building Better Communities With Research
The process of conducting a community-well being study starts with establishing the expectation to conduct the study more than once to measure change over time.
The Siena College Research Institute has worked with communities in New York, Connecticut, and Rhode Island to measure well-being and progress made towards advancing the quality of life for all residents. This process entails:

Analyzing survey findings to develop a community baseline.

Presenting research results on indicators to stakeholders and residents.

Implementing recommendations and initiatives to build a better community.

Re-administering the survey to compare progress on goals and programs.
General Methodology
Generally, the Siena College Research Institute (SCRI) will conduct thousands of interviews over the span of multiple months to residents age 18 and older within a geographic area to ensure a representative sample is collected. SCRI contacts respondents via landline telephone, cell phone, or online. Telephone surveys are conducted in English and Spanish. Web surveys can be conducted in a variety of languages based on the population in the geographic area. After data collection is complete, survey results are weighted by age, gender, education, race/ethnicity, and religion to ensure statistical representativeness.
Community Utilization
The Siena College Research Institute proudly works with governments, nonprofits, and community partners to organize this research. Through this partnership, communities are able to pilot and measure the impact of initiatives and identify macro-trends impacting residents.