
First Annual Survey of New York State Business Leaders
The Siena College Research Institute (SRI) in partnership with First Niagara Bank conducted the first annual Survey of New York State Business Leaders between October 15 and December 11, 2007.
This report summarizes the survey methodology, presents the data from the 403 survey respondents and introduces the “Index of New York State Business Leaders.”
Methods and Data Collection
SRI developed a universe of 2872 businesses from the four upstate metropolitan statistical areas (MSA’s) of Albany (Capital Region), Rochester, Syracuse and Buffalo. The universe included all
private, for-profit businesses with yearly sales of $5 million to $150 million according to publicly available records. Each business received an invitation and survey via mail, a follow up reminder
postcard and, of those that did not respond, a telephone call reminder. The original sample included businesses from the four MSA’s in the following percentages: Albany 21%, Rochester 28%,
Syracuse 17% and Buffalo 34%.
Each business had the opportunity to respond to the survey by 1) returning the paper survey in an enclosed prepaid envelope, 2) completing the survey on a website developed for that purpose
(www.siena.edu/sri/businessleadersurvey ) or 3) requesting a telephone interview.
A total of 403 unique New York State business leaders completed the survey. The completed surveys
were from the following MSA’s: Albany 32%, Rochester 31%, Syracuse 14% and Buffalo 23%. Overall the survey had a response rate of 14%.
Description of the Sample
The 403 respondents from the four different MSA’s represent seven major industry categories with 4% of respondents self-identifying and coded as “Other.” Politically the sample described itself as
more conservative than liberal. Sixteen percent described themselves as “very conservative”, and
44% chose “conservative. Twenty-eight percent self-identified as “moderate”. Only 12% see themselves as politically liberal (11% “liberal” and 1% “very liberal”).
Confidence in the Economy
A major goal of the survey is to measure the current and future confidence of these business leaders in the economy of New York State in general, and specifically, as that climate impacts their industry. Each respondent answered a sequence of four questions that addressed their attitude towards the current economy, as compared with six months ago, both in general and their industry as well as questions that probed their expectations of the state of the economy as we move into and through 2008 both in general and in their specific industry. Each of these four questions had identical
response categories.
- As you think about the current business or economic conditions in New York State as compared to six months ago, would you say they are considerably better, a little better, about the same, a little worse, or considerably worse?
- Looking forward from today through next year, that is, the entire 2008 year, how would you describe your expectations for the economy in New York State?
- Now thinking specifically about your industry, how would you describe the current business or economic conditions in New York State as compared with six months ago?
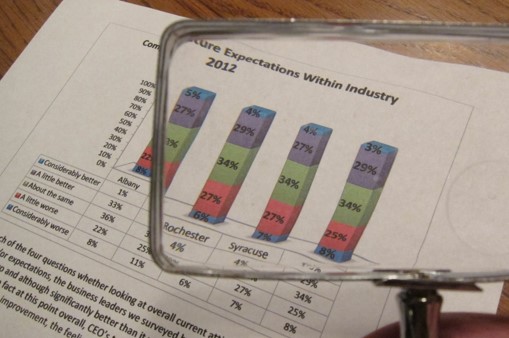
- And looking forward from today through the next year, how would you describe your expectations for your industry here in New York?
We first show the percentage responses to these questions among the entire sample followed for each question by the percentaged breakdown by MSA for each question and then describe the manner in which they have been combined to construct the “Index of New York State Business Leaders.”
It is clear that for each of the four questions whether looking at overall current attitudes, future expectations or within industry attitudes and/or expectations, the business leaders we surveyed believe that the economy is worse today than it was six months ago and will continue to move in a negative direction. By a margin of nearly 3:1 (42% to 16%) business leaders are inclined to say that the business climate in NY is worse than it was six months ago. Looking forward, nearly 49% are inclined to expect a worsening of economic conditions in the state over the next year as compared with 19% that expect the economy to improve. Within their own industry, 42% believe that the conditions have worsened as compared with six months ago while only 21% believe that their industry conditions have recently improved. Looking forward within their industry the sample is slightly more optimistic with 26% seeing improving conditions and 39% seeing conditions deteriorate.
In order to facilitate discussion of this data as well as to compare business leaders in one MSA with another and to establish a baseline for future comparisons, we construct the Index of New York State Business Leaders. The index is based on these four questions that measure current attitudes and future expectations both of the state economy and within industry prospects. We build the index by establishing a relationship between the percentage of respondents that see or expect improvement with those that recognize or anticipate decline. The index for the entire sample or of any identified subset can be determined and ranges from an absolute low of zero to a high of 200. If equal numbers of respondents indicated “better” and “worse” on the four questions the index would be 100. Therefore any score below 100 points to more respondents seeing and/or expecting things to worsen as opposed to improve.
In constructing the Index of New York State Business Leaders, we provide three separate indexes; the overall, the current (based on the two questions that assess attitudes towards the current climate as compared to six months ago) and the future (based on the two forward looking questions).
The Overall Index for New York State = 77.7
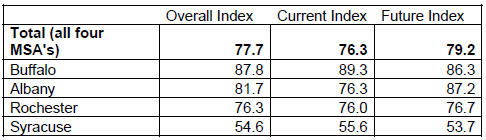
Here using the index we see that the overall index exceeds the composite index of the four MSA’s for both Buffalo and Albany. Rochester’s index is just below that of the upstate figure but Syracuse lags well behind. The one MSA that shows a marked difference between Current and Future is Albany with the highest Future index of 87.2.
This index provides an indication of confidence among business leaders by MSA and offers a measure that can be tracked in the years to come.
Revenue and Profits
Despite the worsening appraisal of the overall economy and the industries of these business leaders, they have a more optimistic, but guarded and concerned view of their own firms. Fifty-one percent of respondents predict that their revenues will grow this year while only 15% expect revenues to decrease. Forty percent expect an increase in profitability while 27% anticipate a decrease in profits.
Although more respondents predict both increasing revenues and profits than expect declines, not all leaders that expect increasing revenues believe those revenues will translate into profits. When asked to identify the strategy that they would employ so as to generate increasing profits, the most often cited one was “Market/demand growth” with “Cost reduction” second. Only 8% of CEO’s plan to increase prices.
Again we now show the data for revenue and profitability expectations by MSA. We also add the data for revenue expectations among existing customers. It is important to remember in looking at individual MSA’s that this data is not directly reflected in the Index and therefore similarity of confidence trends reflected in revenue and/or profitability predictions serves to further validate the Index.
Fixed Assets and Labor Workforce
Business leaders in New York are cautious and concerned. They are committed however to their businesses, expect revenues to increase and are working towards profitability. They are in no way ‘closing their doors.’ In fact, 63% of CEO’s plan to invest in the acquisition of fixed assets over the next year. They are investing in their businesses. Of those that intend to invest in fixed assets, 55% plan to use internally generated funds while 38% intend to finance with the assistance of a financial institution. This would appear to be consistent with cautious yet committed growth.
The commitment to labor seems to mirror that of fixed assets. Fifty-Eight percent of respondents plan to keep their workforce at the current level. Only 6% plan to decrease the size of their labor force. Over one-third, 34% plan to increase their labor force moderately and 2% are planning a substantial increase.
All in all planning of increased assets and labor is in keeping with an attitude of careful and watchful growth. These CEO’s are willing to invest and employ in order to compete and to satisfy their
customers, but not in any cavalier fashion.
Areas of Concentration and Challenge
We provided these CEO’s with two lists – areas of concentration and challenge – and asked them to indicate which applied to them. The most often cited areas of concentration were “Growth in existing
products” and “Expansion in existing markets.” In other words, these business leaders are focused on doing a better job with what they currently do and in the arenas they currently do business. It has the
feel of a “concentrate on the fundamentals” mentality. Still, nearly 42% plan to expand into new markets and 36% are focused on technology innovations.
The most often cited challenge or concern among the business leaders were “Taxation” and “Energy costs” with “Governmental regulation” and “Rising supplier costs” also of significant concern.
The largest concerns and challenges are those factors that are simultaneously predicted yet outside of the control of these leaders. In looking at these areas of concentration and challenge by MSA we group those concentrations and challenges that appear most important to the CEO’s and label them in bands of lessening focus (note- percentages exceed 100 for each geography as respondents could check all areas of both concentration and challenge that applied to them).