-
Cuomo Leads Molinaro 50-28 Percent; Nixon Gets 10 Percent on WFP Line; Other Minor Party Candidates Get 4 Percent
-
Voters Say Cuomo Better on 5 Issues; Molinaro Better on Corruption
-
Gillibrand & DiNapoli Each Lead Their Opponents by 32 Points; James Leads Wofford by 14 Points, 50-36 Percent
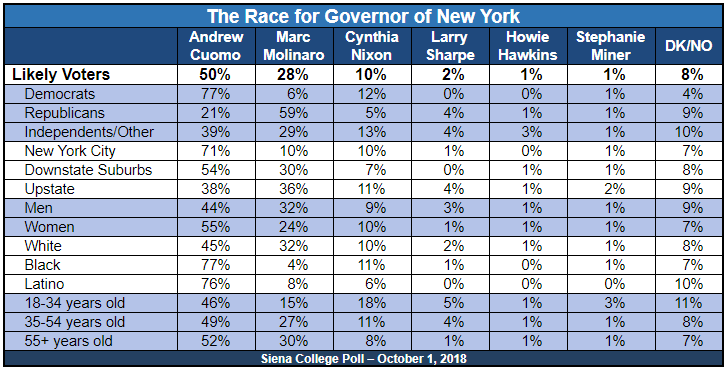
Loudonville, NY Incumbent Democrat Andrew Cuomo leads Republican Marc Molinaro 50-28 percent in a six-person field for Governor. Working Families Party candidate Cynthia Nixon has the support of 10 percent and the other three minor party candidates receive combined support of four percent, with eight percent still undecided, according to a new Siena College poll of likely New York State voters released today.
Senator Kirsten Gillibrand holds a 61-29 percent lead over her little-known Republican opponent, Chele Chiavacci Farley. State Comptroller Tom DiNapoli leads Republican Jonathan Trichter 58-26 percent. The race for Attorney General is closer, with Democrat Tish James, New York City’s Public Advocate, leading Republican Keith Wofford 50-36 percent. Farley, Trichter and Wofford are all first-time candidates.
“With a little more than a month until voters go to the polls, Cuomo has a strong 22- point lead over Molinaro among likely voters. Although Cuomo only has the support of half of voters, a relatively large number of voters,
14 percent, currently say they are planning to vote for one of the four minor party candidates,” said Siena College pollster Steven Greenberg. “Cuomo is doing a better job holding his base, leading Molinaro among Democrats 77-6 percent, while Molinaro only leads among Republicans 59-21 percent. Independents favor Cuomo 39-29 percent, although 21 percent of them say they are supporting one of the other candidates.
“Cuomo routs in New York City by 61 points and leads by 24 points in the downstate suburbs. Upstate voters are closely divided with 38 percent supporting Cuomo, 36 percent with Molinaro and 18 percent with another candidate,” Greenberg said. “With a significant gender gap, Cuomo leads by 12 points with men and 31 points with women. Cuomo leads 45-32 percent with white voters and has the support of more than three-quarters of black and Latino voters. Even though Cuomo has support from nearly every major union in New York, he leads by 23 points in households with a union member and the same 23 points in households without a union member.”

Cuomo is viewed favorably by 50 percent of likely voters and unfavorably by 46 percent, his highest unfavorable rating ever. Molinaro has a 24-20 percent favorability rating, with 56 percent either not knowing him or not having an opinion. Nixon has a negative 28-49 percent favorability rating. Howie Hawkins, Stephanie Miner and Larry Sharpe are each unknown to more than three-quarters of voters.
“A strong majority of voters say Cuomo would be better than Molinaro on three issues: improving public education, fixing New York’s infrastructure and creating jobs. A plurality of voters also say Cuomo is better on creating a fair tax structure and focusing on the unique problems of upstate New York, although a plurality of upstate voters say Molinaro would be better on that issue,” Greenberg said. “By a small 41-36 percent margin, voters say Molinaro would be better on combatting corruption in state government. Independents and upstate voters give Molinaro the nod on combatting corruption by more than two-to-one.
“Five weeks is a long time in the world of campaigns. However, Molinaro remains largely unknown to more than half of voters, trails Cuomo badly in the money game and faces an electorate with more than twice as many Democrats as Republicans in a blue state that hasn’t gone red in a statewide election since 2002,” Greenberg said.
Gillibrand Holds 32-Point Lead Over Little-Known Farley
“Although her favorability rating has fallen to 49-33 percent from 53-28 percent in June, Gillibrand still has a commanding 61-29 percent lead over Farley, who is unknown to 87 percent of voters. Gillibrand’s lead is virtually unchanged from 61-28 percent in June,” Greenberg said. “Gillibrand leads 86-7 percent with Democrats,
while Farley only leads with Republicans 60-29 percent. Gillibrand leads 55-31 percent with independents. She leads in New York City by 62 points, in the downstate suburbs by 31 points and upstate by 17 points.”
DiNapoli Maintains Commanding Lead in Bid for Re-election
“DiNapoli’s 29-9 percent favorability rating is stronger than Trichter’s 5-6 percent favorability rating. And while the challenger, taking on his first race for public office, is unknown to 89 percent of voters, the 11-year incumbent, who’s won two statewide elections – receiving more votes than anyone else in New York in 2014 –
remains unknown to 62 percent of voters,” Greenberg said. “That said, DiNapoli maintains a commanding
58-26 percent lead over Trichter, little changed from 56-22 percent lead in June.
James Leads Wofford 50-36 Percent in Race for Attorney General
“In the tightest of the statewide races – and a first for New York, with two black candidates – James holds a
14-point lead, 50-36 percent, over Wofford. Both candidates do well with voters of their own party. James leads 82-10 percent with Democrats and Wofford leads 73-12 percent with Republicans. Independents are closely divided, tilting toward James 40-38 percent,” Greenberg said. “James leads by a commanding 63 points in New York City. She leads by seven points in the downstate suburbs and Wofford leads by seven points upstate.
“James crushes Wofford with black and Latino voters, while white voters narrowly lean toward James,
44-41 percent,” Greenberg said. “Wofford has an 8-5 percent favorability rating and is unknown to 86 percent of voters. James – with a 63-13 percent favorability in New York City, where she’s won citywide office twice – has a 31-10 percent favorability rating, although she is unknown to about two-thirds of voters outside the City.
Dems Want Dems in November; Reps Want Reps; Independents Give Small Edge to Dems for the House
By 56-39 percent, virtually unchanged from 55-39 percent in June, voters say they want to see the House of Representatives controlled by the Democrats next year and by 54-40 percent, up a little from 52-42 percent in June, they want Democrats to control the State Senate.
“Democrats want Democrats to control the House of Representatives next year 88-10 percent, while Republicans want their party in control 80-16 percent. Independents side with Democrats 47-40 percent,” Greenberg said. “Democrats and Republicans feel virtually the same in their support for their own party to control the State Senate after the elections, however, independents are evenly divided, 44-44 percent. In the battlegrounds where State Senate control will be determined, downstate suburban voters lean toward the Democrats 49-40 percent, while upstaters lean toward the Republicans 52-43 percent.”
# # #
This Siena College Poll was conducted September 20-27, 2018 by telephone calls conducted in English to 701 likely New York State 2018 general election voters. Calls were made to a sample of registered voter households and initiated by asking for the youngest person in the household. It has an overall margin of error of +/- 3.9 percentage points including the design effects resulting from weighting. Sampling was conducted via a stratified dual frame sample of landline and cell phone telephone numbers from the L-2 Voter list. A likely-to-vote probability was computed for each respondent based on both their stated likelihood to vote as well as by virtue of the imputation of a turnout probability score based on past household voting behavior. This probability to vote was applied as a weight along with a weight that considered historic party by region turnout, age and gender. The Siena College Research Institute, directed by Donald Levy, Ph.D., conducts political, economic, social and cultural research primarily in NYS. SCRI, an independent, non-partisan research institute, subscribes to the American Association of Public Opinion Research Code of Professional Ethics and Practices. For more information, call Steve Greenberg at (518) 469-9858. For survey cross-tabs: www.Siena.edu/SCRI/SNY.


