-
The New York Times Upshot / Siena College California 49 Poll:
-
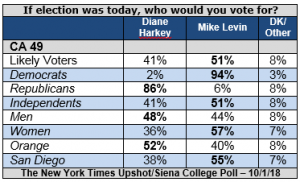
Democrat Levin 51% Republican Harkey 41%
-
Voters Prefer Democrats Control House 54-42%; Give President Trump Large Negative 41-55% Job Approval Rating
-
Favorability Ratings: Harkey, 27-18 Percent; Levin, 36-12 Percent
 Loudonville, NY. Democratic lawyer Mike Levin holds a 10-point lead over Republican former state legislator Diane Harkey, 51-41 percent, according to a new New York Times Upshot/Siena College poll of likely California 49th Congressional District voters. Harkey has a 27-18 percent favorability rating, compared to a 36-12 percent favorability rating for Levin.
Likely voters in this southern California district prefer Democrats rather than Republicans control the House of Representatives next year, 54-42 percent. Voters give President Trump a large 14-point negative job approval rating with 41 percent approving the job he is doing and 55 percent disapproving and by 47-41 percent they oppose Brett Kavanaugh’s nomination to the United States Supreme Court.
This New York Times Upshot/Siena College Poll is part of an ongoing project polling pivotal Congressional races across the country. The data is published live on https://www.nytimes.com/section/upshot. This press release highlights the key findings and provides access in the cross-tabulations to the entire survey as well as how demographic groups answered each question.
# # #
This New York Times Upshot/Siena College CA 49 survey was conducted September 18-23, 2018 by telephone calls in English and Spanish to 507 CA 49 voters. This poll has a margin of error of +/- 4.7 percentage points. Calls were made to a stratified weighted sample of voters from the L-2 Voter list via both land and cell phones. A likely-to-vote probability was computed for each respondent based on their stated likelihood to vote as well as by virtue of the imputation of a turnout probability score based on past voting behavior. This combined probability to vote score was applied as a weight along with a weight that considered party, age, race/ethnicity, education, region within the district and gender. Polling support for this project provided by Institute for Policy and Opinion Research at Roanoke College, Reconnaissance Market Research, M. Davis & Company, The Public Opinion Research Lab at the University of North Florida and The Survey Research Center at the University of Waterloo. The Siena College Research Institute, directed by Donald Levy, Ph.D., conducts political, economic, social and cultural research primarily in NYS. SCRI, an independent, non-partisan research institute, subscribes to the American Association of Public Opinion Research Code of Professional Ethics and Practices. For more information, please call Steven Greenberg at 518-469-9858 or Don Levy at 518-783-2901. Survey cross-tabulations and frequencies can be found at: www.Siena.edu/SCRI/SNY.


