

-
Cuomo Leads Molinaro by 19 Points Among Likely Voters;
-
Expands Lead Over Nixon to 35 Points with Democrats
-
Gillibrand & DiNapoli Have Large Early Leads vs. Unknown Challengers
-
Dem AG Primary Wide Open with Three Candidates Unknown to Majority of Democrats; Little Known Rep Waits to Learn Opponent
-
Trump Ratings (Still Underwater) Jump to Best Since Becoming President
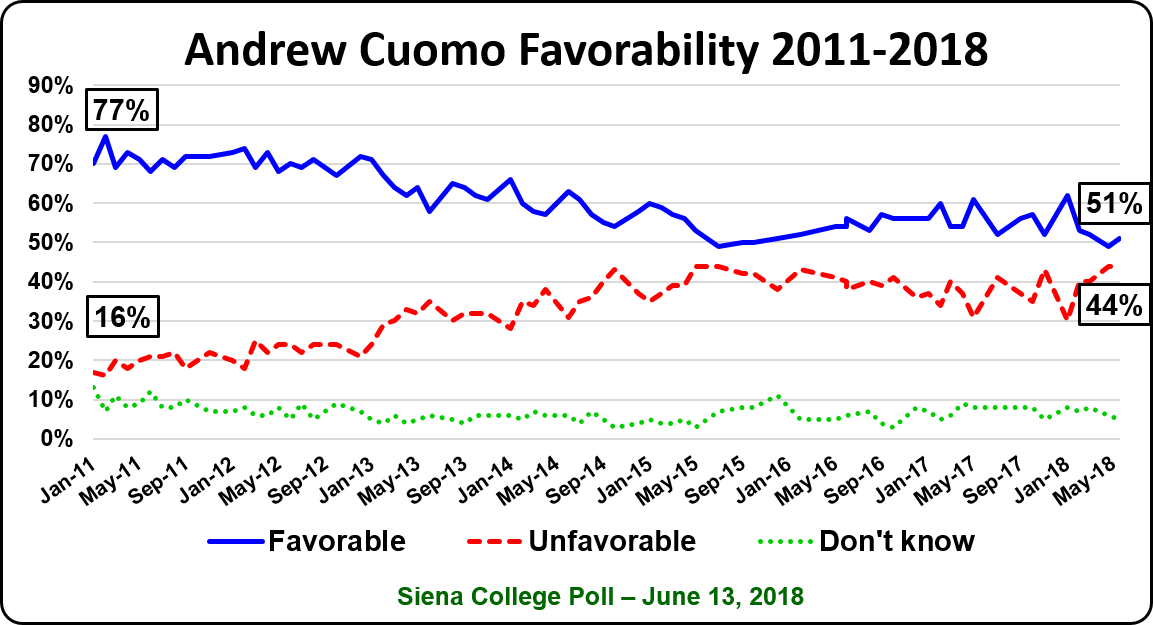
Loudonville, NY. Governor Andrew Cuomo has a 51-44 percent favorability rating among likely general election voters, compared to 49-44 percent in April among registered voters. He leads Dutchess County Executive Marc Molinaro – who is essentially unknown to more than two-thirds of likely voters – 56-37 percent, according to a new Siena College poll of likely New York State general election voters.
Among Democrats polled, Cuomo leads Cynthia Nixon 61-26 percent (up from 58-27 percent in Siena’s April poll of registered voters). Nixon, too, leads Molinaro but by a narrower 46-35 percent margin.
Senator Kirsten Gillibrand holds a 61-28 percent lead over her little-known Republican opponent, Chele Chiavacci Farley, and State Comptroller Tom DiNapoli leads Republican Jonathan Trichter 56-22 percent. The race for Attorney General appears wide open as none of the candidates tested has significant name recognition.
“With the Democratic primary three months away, Democrats strongly view Cuomo favorably, 67-28 percent, while they view Nixon favorably by a smaller 40-26 percent. He has a 72-23 percent favorability rating among self-described liberals, while liberals view Nixon favorably 51-18 percent,” said Siena College pollster Steven Greenberg. “Nixon has a lot of catching up to do to make this race competitive. Cuomo is well known and well liked by New York Democrats. Although similar percentages of Democrats view Cuomo and Nixon unfavorably, Cuomo has a significantly larger percentage of Democrats viewing him favorably.
“Cuomo has the support of almost two-thirds of Democrats in New York City and more than three-quarters in the downstate suburbs. While he has a narrower 47-39 percent lead upstate, upstate accounted for only about one-third of the 2014 primary vote,” Greenberg said. “There is no gender gap to favor Nixon, as Cuomo leads with men by 31 points and with women by 37 points. He also leads among black voters 74-17 percent.”
“Looking ahead to the general election, Molinaro also has a lot of work to do if he wants to be the first Republican to win statewide in 16 years. Molinaro has an 18-11 percent favorability rating, with 71 percent of likely voters unable to offer an opinion about him,” Greenberg said.
“Cuomo has nearly twice the support of Republicans, 25 percent, as Molinaro has support among Democrats,
13 percent, with independents giving Cuomo a narrow four-point edge,” Greenberg said. “While Molinaro has a six-point lead upstate, Cuomo has a huge 65-point lead in New York City and a 17-point lead in the downstate suburbs, where Republicans have to win – or at least keep it close – to win statewide.
“In June 2014, Cuomo led then-Republican candidate Rob Astorino 57-21 percent in a Siena College poll, before going on to beat Astorino 54-40 percent in November 2014,” Greenberg said.
Gillibrand Holds 33-Point Lead Over Little-Known Farley
“With a nearly two-to-one, 53-28 percent, favorability rating, Gillibrand has a commanding 61-28 percent lead over Farley, who is unknown to nine out of ten likely New York voters,” Greenberg said. “Gillibrand leads by more than 70 points with Democrats, 83-9 percent, and 27 points with independents, 56-29 percent. Farley’s lead among Republicans, 56-31 percent, is slightly smaller than Gillibrand’s lead with independents.”
DiNapoli in Strong Position to Win Re-Election
“After more than 11 years as State Comptroller, DiNapoli remains unknown to more than half the electorate. He has a 32-15 percent favorability rating. Of course, that compares to 5-5 percent favorability rating for Trichter. DiNapoli leads Trichter 56-22 percent and only trails him among Republicans, 45-35 percent,” Greenberg said.
James Has Early Lead (Prior to Maloney’s Entry) in Dem. AG Primary
New York City Public Advocate Letitia James has a 20-10 percent favorability rating, including 32-9 percent with Democrats. Zephyr Teachout has a comparable 17-12 percent favorability rating, including 26-8 percent with Democrats. Leecia Eve has a 5-4 percent favorability rating. Keith Wofford has a 5-5 percent favorability rating. This poll commenced prior to Representative Sean Patrick Maloney announcing his candidacy.
“While none of the three Democratic women running for Attorney General is widely known among likely general election voters, James and Teachout have the strongest favorability ratings among Democratic voters,” Greenberg said. “Due to her strength in New York City where she has a large lead, garnering 45 percent support, James has the early lead among Democrats with 28 percent support, compared to Teachout’s 18 percent and Eve’s four percent. Nearly half of Democrats say they are still undecided. And that’s before Maloney enters the mix.
“Former Attorney General Eric Schneiderman – who had a 37-17 percent favorability rating in April – is viewed favorably by 21 percent and unfavorably by 44 percent of voters, a net drop of 43 points,” Greenberg said.
Trump Sees Rating Improve but Remains Significantly Underwater with New York Voters
President Donald Trump has a negative 38-59 percent favorability rating among likely voters, up from negative 31-65 percent among registered voters in April. His job performance is negative 36-63 percent, up from negative 27-71 percent in April.
“Although he remains significantly underwater with voters in his home state, Trump has the best favorability and job performance ratings he’s had since assuming office,” Greenberg said. “He is viewed favorably by 68 percent of Republicans – almost two-thirds of whom also give him a positive job performance rating – while being viewed unfavorably by 82 percent of Democrats and 54 percent of independents.
“Similarly, the view of voters about the direction of the country has improved dramatically, while still remaining significantly negative. By a 54-39 percent margin, voters say the country is headed in the wrong direction, however, that’s down from 63-30 percent feeling the country was headed in the wrong direction in April,” Greenberg said. “Nearly three-quarters of Democrats say the country is headed in the wrong direction, while nearly two-thirds of Republicans say the country is on the right track. Independents are closely divided.”
Dems Want Dems in November; Reps Want Reps; Independents are Closely Divided
Overall, 43 percent of likely voters say they plan to vote for the Democrat for Representative in Congress compared to 28 percent who say they’ll vote Republican. Similarly, by a 40-31 percent margin, voters say they’ll vote for the Democrat for State Senate, and by a 42-27 percent margin, support the Democrat for State Assembly. By 55-39 percent, voters say they want to see the House of Representatives controlled by the Democrats next year and by 52-42 percent, they want Democrats to control the State Senate.
“Not surprisingly, approximately 70 percent of Democrats say they will vote for the Democratic candidate in races for Congress, State Senate and Assembly, and at least 61 percent of Republicans say they will vote for the Republican candidate in each of those races. Independents are closely divided between candidates in each party in each of those elections,” Greenberg said. “Similarly, Democrats overwhelmingly want Democrats in charge of the House of Representatives and the State Senate, while Republicans overwhelmingly want the GOP to control both. Independents are closely divided when it comes to House and State Senate control, although they favor the Republicans in each by narrow margins.”
# # #
This Siena College Poll was conducted June 4-7, 2018 by telephone calls conducted in English to 745 New York State likely 2018 general election voters. Calls were made to a sample of registered voter households and initiated by asking for the youngest person in the household. It has an overall margin of error of +/- 3.6 percentage points including the design effects resulting from weighting. Sampling was conducted via a stratified dual frame sample of landline and cell phone telephone numbers from the L-2 Voter list. A likely-to-vote probability was computed for each respondent based on both their stated likelihood to vote as well as by virtue of the imputation of a turnout probability score based on past household voting behavior. This probability to vote was applied as a weight along with a weight that considered historic party by region turnout, age and gender. The Siena College Research Institute, directed by Donald Levy, Ph.D., conducts political, economic, social and cultural research primarily in NYS. SCRI, an independent, non-partisan research institute, subscribes to the American Association of Public Opinion Research Code of Professional Ethics and Practices. For more information, call Steve Greenberg at (518) 469-9858. For survey cross-tabs: www.Siena.edu/SCRI/SNY.SNY.